Setting up a Kubernetes cluster is one of those things that feels like a massive victory until you realize you have no idea what is actually happening inside of it. When I first started working with Kubernetes, I spent way too many nights staring at “CrashLoopBackOff” errors, wondering which specific pod was eating all the memory. This is where Datadog comes in. It is one of the most powerful observability platforms out there, but getting it into your cluster effectively requires a bit of a learning curve. The most common and recommended way to do this is through the Datadog Helm chart. In this guide, I want to walk you through everything I have learned about using the Datadog Helm chart, from the basic installation to the complex configurations that will save you time and money.
What exactly is the Datadog Helm Chart?
Before we jump into the technical commands, we should talk about what we are actually doing. Helm is often called the “package manager for Kubernetes.” If you think of Kubernetes as an operating system, Helm is like the app store. Instead of manually writing dozens of YAML files to deploy the Datadog Agent, the Cluster Agent, and all the necessary permissions, the Helm chart bundles all of that into a single, configurable package.
When you install the Datadog Helm chart, you are essentially deploying a “DaemonSet.” This is a fancy Kubernetes term that means one copy of the Datadog Agent will run on every single node in your cluster. This is crucial because the agent needs to be physically present on the host to collect hardware metrics, listen to Docker or containerd events, and scrape logs. It is a very efficient way to ensure that as your cluster grows and you add more nodes, your monitoring automatically scales with it without you having to lift a finger.
Getting Started: The Prerequisites
I have seen many people fail at the first step because they rushed in without the right credentials. To use the Datadog Helm chart, you need three main things. First, you need a functioning Kubernetes cluster with kubectl configured. Second, you need Helm installed on your local machine. Third, and most importantly, you need your Datadog API key and your Datadog Site.
The “Site” is a common point of confusion. Depending on where your Datadog account was created, your site might be datadoghq.com (US1), datadoghq.eu (Europe), or even us3.datadoghq.com. If you provide the wrong site in your Helm configuration, your agents will try to send data to the wrong server, and you will see “403 Forbidden” or “Connection Refused” errors in your logs. Always double-check your URL in the Datadog dashboard before you start.
The Basic Installation Process
The actual installation is surprisingly fast. First, you need to add the Datadog repository to your Helm setup. You do this by running helm repo add datadog https://helm.datadoghq.com. After that, make sure to run helm repo update to ensure you have the latest version of the chart.
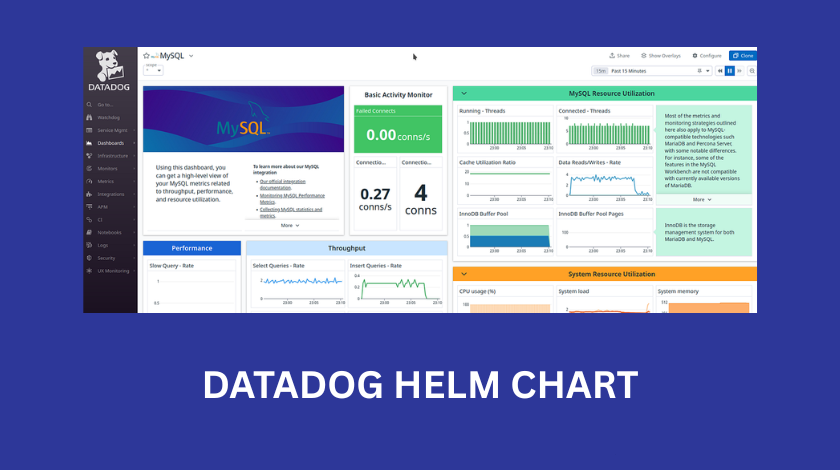
For a very basic installation, you could technically run a long command with several --set flags, but I strongly advise against this. Instead, you should create a file called values.yaml. This file will be your source of truth. In this file, you will define your API key and the site. Once that file is ready, you run helm install datadog-agent -f values.yaml datadog/datadog. Within a few minutes, you should see your nodes appearing in the Datadog Infrastructure List. It feels like magic when those first few lines of data start populating the graphs.
Deep Diving into the values.yaml File
The values.yaml file is where the real work happens. This is where you tell Datadog exactly how to behave. One of the first things you should look at is the datadog.tags section. I cannot stress enough how important tagging is. In a large environment, looking at a list of 500 pods is useless. However, if you tag your agents with env:production or team:billing, you can suddenly filter your entire dashboard to only show what matters to you.
Another important section is the targetSystem. Since Kubernetes can run on Linux or Windows, you need to make sure the chart knows which one it is dealing with. Most people are on Linux, but if you are running a mixed-node cluster, you will need to handle those configurations separately. I also recommend looking at the resources section. By default, the Datadog agent is fairly lightweight, but in a very busy cluster with thousands of containers, it will need more CPU and memory. Setting “limits” and “requests” ensures that the Datadog agent doesn’t get throttled by Kubernetes, but also ensures it doesn’t accidentally take over the whole node if something goes wrong.
Enabling Logs and APM
Out of the box, the Datadog Helm chart usually only collects basic infrastructure metrics like CPU and RAM. To get the “good stuff” like logs and Application Performance Monitoring (APM), you have to turn them on explicitly in your values.yaml.
To enable logs, you find the datadog.logs.enabled key and set it to true. You also need to enable datadog.logs.containerCollectAll. This tells the agent to grab logs from every container running on the node. Be careful here, though. If you have a chatty application that spits out thousands of lines of useless debug logs, your Datadog bill will skyrocket. I always recommend using the “log processing” features to filter out or exclude certain namespaces that you don’t need to monitor.
APM is a bit more involved. You set datadog.apm.portEnabled to true, which opens up a port (usually 8126) for your applications to send their trace data to. The tricky part is that your application needs to know where to send that data. In a Kubernetes environment, the “where” is the IP address of the node the pod is running on. I usually use the “Downward API” in my Kubernetes deployment manifests to pass the host IP as an environment variable to the app, so it knows exactly how to find the Datadog agent.
Managing Secrets Securely
One thing that keeps me up at night is the thought of API keys being leaked. In many tutorials, you see people pasting their Datadog API key directly into the values.yaml file in plain text. Please do not do this. If you check that file into a Git repository, anyone with access to your code now has your API key.
Instead, you should create a Kubernetes Secret manually by running kubectl create secret generic datadog-secret --from-literal=api-key=YOUR_KEY_HERE. Then, in your Helm values.yaml, you reference this secret using the datadog.apiKeyExistingSecret field. This way, your configuration file only contains the name of the secret, not the sensitive key itself. It is a simple step that makes your entire infrastructure much more secure.
The Role of the Datadog Cluster Agent
As your cluster grows, you will notice a new component called the “Cluster Agent.” In a small dev cluster, you might not need it, but for production, it is essential. The standard Agent runs on every node, but the Cluster Agent acts as a centralized brain for the cluster.
The Cluster Agent does a few vital things. First, it talks to the Kubernetes API server on behalf of all the other agents. Without it, if you have 100 nodes, you have 100 agents hammering the API server for metadata, which can slow down your cluster. The Cluster Agent does this once and shares the data. Second, it handles “External Metrics,” which is a fancy way of saying it can help you scale your pods based on Datadog metrics (like HPA). If you want your web servers to scale up when your Datadog monitors see a spike in traffic, you need the Cluster Agent.
Helm Chart vs. Datadog Operator
I often get asked if one should use the Helm chart or the newer Datadog Operator. The Operator is a more “Kubernetes-native” way of doing things. It watches for a specific Custom Resource Definition (CRD) and manages the lifecycle of the agents for you.
In my experience, the Helm chart is still the better choice for most people because it is simpler to understand and has been around longer. The Operator is powerful, but it adds another layer of abstraction that can be hard to troubleshoot if you aren’t an expert in Kubernetes controllers. If you are just starting out or have a standard deployment, stick with the Helm chart. It is robust, well-documented, and very reliable.
Troubleshooting Common Pitfalls
Even with the best tools, things go wrong. If you don’t see data in your Datadog dashboard, the first thing I always check is the logs of the agent pods. You can do this by running kubectl logs -l app=datadog-agent.
One common issue is “clock skew.” If the time on your Kubernetes nodes is not synchronized with an NTP server, Datadog might reject the data because it looks like it’s from the past or the future. Another issue I’ve run into is permission errors. The Datadog agent needs a “ClusterRole” to see what is happening in the cluster. The Helm chart usually sets this up for you, but if you have a very restrictive security policy (like Pod Security Policies or Admission Controllers), you might need to manually grant the agent the permissions it needs to “get,” “list,” and “watch” resources.
Lastly, watch out for the “ImagePullBackOff” error. This usually happens if your cluster doesn’t have internet access to pull the agent image from Google Container Registry (GCR) or Docker Hub. In private corporate environments, you might need to mirror the Datadog images into your own private registry.
Conclusion
The Datadog Helm chart is a remarkably powerful tool that transforms the chaotic “black box” of Kubernetes into a clear, observable environment. While the initial setup can feel overwhelming due to the sheer number of options in the values.yaml file, the secret is to start small. Get the basic infrastructure metrics working first, then slowly layer on logs, then APM, and finally advanced features like the Cluster Agent.
Monitoring isn’t just about pretty graphs; it is about having the confidence to deploy code on a Friday afternoon because you know that if something breaks, you will see exactly where and why it happened. By following the best practices for security and configuration mentioned here, you are setting yourself up for a much smoother DevOps journey.
FAQ
1. How do I update the Datadog Helm chart to the latest version?
To update, you first run helm repo update to get the latest metadata. Then, find your existing release name (usually datadog-agent) and run helm upgrade datadog-agent -f values.yaml datadog/datadog. Always check the release notes for “breaking changes” before upgrading in production.
2. Can I run the Datadog agent on Fargate?
Yes, but the Helm chart works differently for Fargate. Since you don’t have access to the underlying nodes in Fargate, you cannot use a DaemonSet. Instead, you have to run the Datadog agent as a “sidecar” container within your application pod.
3. Why is my Datadog bill so high after using the Helm chart?
This is usually due to log ingestion or custom metrics. By default, the Helm chart might collect everything. You should use the values.yaml file to exclude unnecessary namespaces and set up “Log Exclusion Filters” in the Datadog UI to drop logs that you don’t need for long-term storage.
4. What is the difference between an API key and an APP key?
The API key is used by the agent to send data to Datadog. The APP key is used to pull data out of Datadog or to manage your account via the API. For the Helm chart, you primarily only need the API key.
5. Does the Datadog Helm chart support OpenTelemetry?
Yes! You can configure the Datadog agent via the Helm chart to act as an OpenTelemetry collector, allowing you to ingest OTLP traces and metrics directly.